Visualization Decision-Making
People use visualizations to make large-scale decisions, such as whether to evacuate a town before a hurricane strike, and more personal decisions, such as which medical treatment to undergo. Given their widespread use and social impact, we believe it is vital to ensure that visualizations clearly and effectively communicate data. We conduct empirical evaluations and qualitative analysis to determine how visualizations both help and hinder the decision-making process. Our goal is to use cognitive science to improve the presentation of information and to train people to be more informed information consumers.
- Topics
- uncertainty visualization, measuring cognitive effort, theoretical models of decision making with visualizations, mental models of data, rainbow color maps, effects of binning continuous data, hurricane forecasting, hazard maps, metaphors
Featured Media
Publications
2022
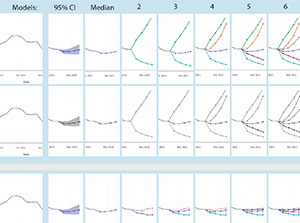
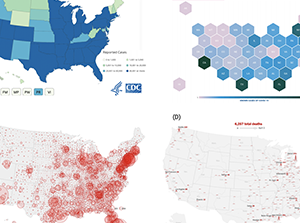
Best Paper Award at VIS 2022. Multiple Forecast Visualizations (MFVs): Trade-offs in Trust and Performance in Multiple COVID-19 Forecast Visualizations
Padilla, L., Fygenson, R., Castro, S., & Bertini, E. (2022). To be presented at VIS 2020.
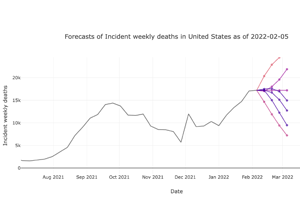
Impact of COVID-19 forecast visualizations on pandemic risk perceptions.
Citation: Padilla, L., Hosseinpour, H., Fygenson, R., Howell, J., Chunara, R., & Bertini, E. (2022). Impact of COVID-19 forecast visualizations on pandemic risk perceptions. Scientific reports, 12(1), 1-14.
2021
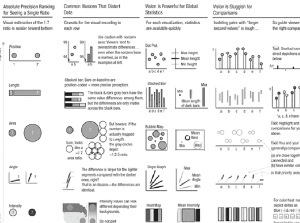
The Science of Visual Data Communication: What Works.
Citation: Franconeri, S. L., Padilla, L. M., Shah, P., Zacks, J. M., & Hullman, J. (2021). The science of visual data communication: What works. Psychological Science in the Public Interest, 22(3), 110-161.
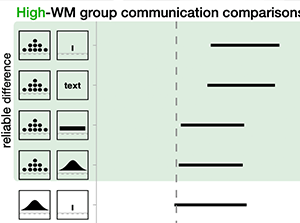
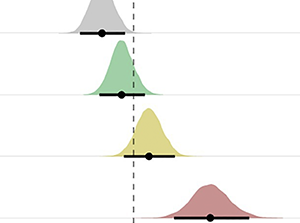
Examining Effort in 1D Uncertainty Communication Using Individual Differences in Working Memory and NASA-TLX.
Citation: Spencer C Castro, Helia Hosseinpour, P Samuel Quinan, Lace Padilla (2021 in press). IEEE VIS 2021.
Conceptual metaphor and graphical convention influence the interpretation of line graphs.
Citation: Greg Woodin, Bodo Winter, and Lace Padilla (2021 in press). IEEE VIS 2021.
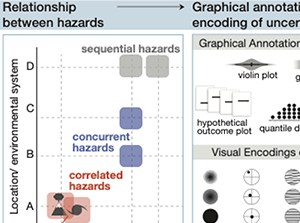
Multiple Hazard Uncertainty Visualization Challenges and Paths Forward.
Citation: Padilla, L. M., Dryhurst, S., Hosseinpour, H., & Kruczkiewicz, A. (2021). Multiple Hazard Uncertainty Visualization Challenges and Paths Forward. Frontiers in Psychology, 12, 1993.
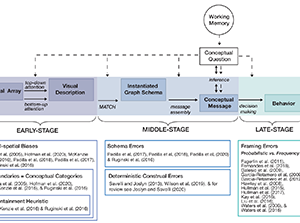
A review of uncertainty visualization errors: Working memory as an explanatory theory.
Citation: Padilla, L., Castro, S. C., & Hosseinpour, H. (2021). A review of uncertainty visualization errors: Working memory as an explanatory theory. In K. D. Federmeier (Ed.), The psychology of learning and motivation (Vol. 74, pp. 275–315). Psychology of Learning and Motivation. Academic Press. doi:https://doi.org/10.1016/bs.plm.2021.03.001
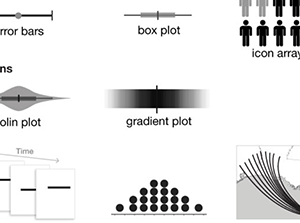
Uncertainty Visualization (book chapter)
Citation: Padilla, Kay, & Hullman (in press). Uncertainty Visualization. To appear in, Handbook of Computational Statistics and Data Science.
Mapping the Landscape of COVID-19 Crisis Visualizations
Citation: Zhang, Y., Sun, Y., Padilla, L., Barua, S., Bertini, E., & Parker, A. G. (2021). Mapping the Landscape of COVID-19 Crisis Visualizations. To apprear in CHI 2021.
Uncertain about uncertainty: How qualitative expressions of forecaster confidence impact decision-making with uncertainty visualizations
Citation: Padilla, L. M., Powell, M., Kay, M., & Hullman, J. (2021). Uncertain about uncertainty: How qualitative expressions of forecaster confidence impact decision-making with uncertainty visualizations. Frontiers in Psychology, 11.
2020
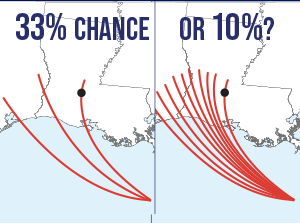
The Powerful Influence of Marks: Visual and Knowledge-Driven Processing in Hurricane Track Displays
Citation:Padilla, L. M., Creem-Regehr, S. H., & Thompson, W. (2020). The powerful influence of marks: Visual and knowledge-driven processing in hurricane track displays. Journal of Experimental Psychology: Applied, 26(1), 1.
2019
Toward objective evaluation of working memory in visualizations: A case study using pupillometry and a dual-task paradigm.
Citation: Padilla, L., Castro, S., Quinan, P., Ruginski, I. & Creem-Regehr, S. (2019, October). Examining Implicit Discretization in Spectral Schemes. IEEE transactions on visualization and computer graphics. VIS 2019.
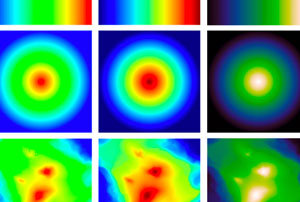
Examining Explicit Discretization in Spectral Schemes
Citation: Quinan, P., Padilla, L., Creem-Regehr, S., & Meyer, M. (2019, May). Examining Implicit Discretization in Spectral Schemes. Computer Graphics Forum.
2018
A Case for Cognitive Models in Visualization Research
Citation: Padilla, L. (2018, October). A Case for Cognitive Models in Visualization Research. In Proceedings of the Seventh Workshop on Beyond Time and Errors on Novel Evaluation Methods for Visualization (pp. 143-151). ACM.
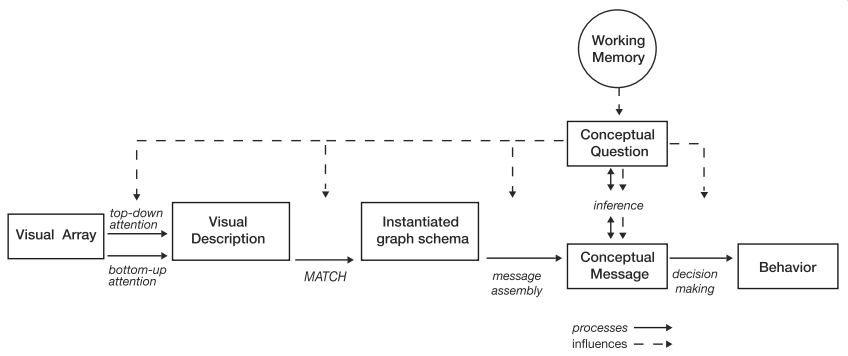
Decision Making with Visualizations: A Cognitive Framework Across Disciplines
Citation: Padilla, L., Creem-Regehr, S. H., Hegarty, M., & Stefanucci, J. K. (2018, July). Decision making with visualizations: a cognitive framework across disciplines. Cognitive Research: Principles and Implications, 3(1), 29. doi:10.1186/s41235-018-0120-9
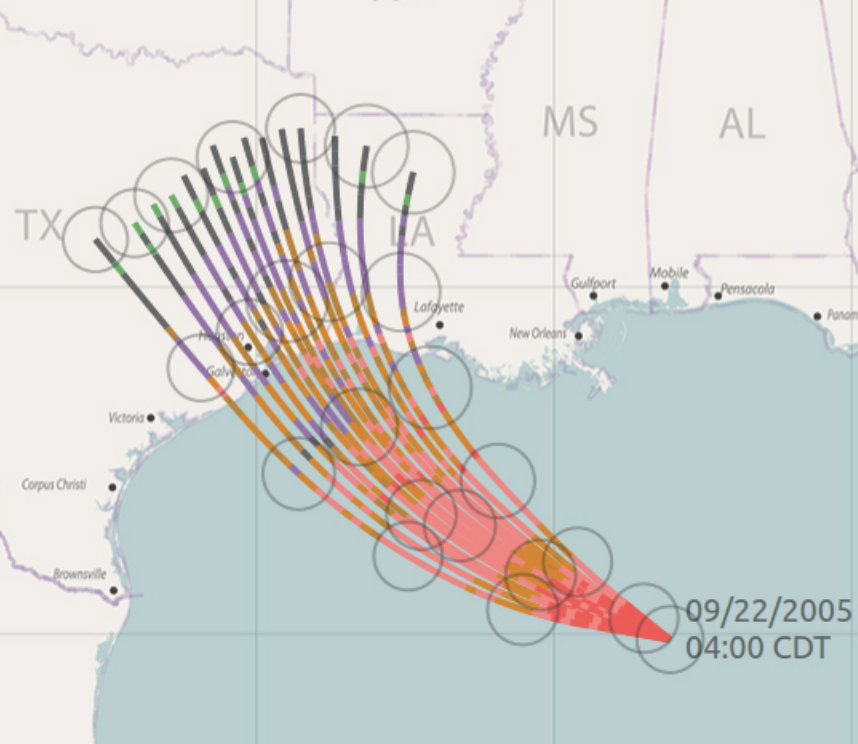
Visualizing uncertain tropical cyclone predictions using representative samples from ensembles of forecast tracks
Citation: Liu, L., Padilla, L., Creem-Regehr, S., & House, D. (2018). Visualizing uncertain tropical cyclone predictions using representative samples from ensembles of forecast tracks. IEEE transactions on visualization and computer graphics.
*Downloads: Supplementary Materials, Visualization technique code, and User study analysis R code + data
*Downloads: Supplementary Materials, Visualization technique code, and User study analysis R code + data
2017
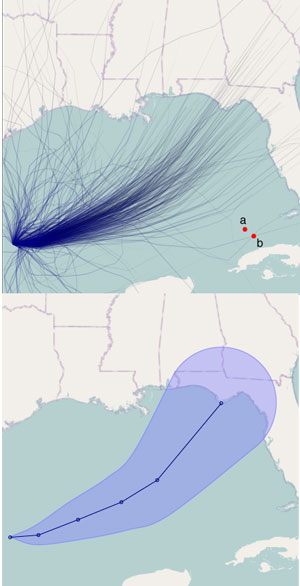
Effects of Ensemble and Summary Displays on Interpretations of Geospatial Uncertainty Data
Citation: Padilla, L., Ruginski, I., Creem-Regehr, S. H. (2017). Effects of Ensemble and Summary Displays on Interpretations of Geospatial Uncertainty Data. Cognitive Research: Principles and Implications,2(1), 40. https://doi.org/10.1186/s41235-017-0076-1.
*Downloads: Data
*Downloads: Data
Uncertainty Visualization by Representative Sampling from Prediction Ensembles
Citation: Liu, L., Boone, A. P., Ruginski, I. T., Padilla, L., Hegarty, M., Creem-Regehr, S. H., ... & House, D. H. (2017). Uncertainty Visualization by Representative Sampling from Prediction Ensembles. IEEE transactions on visualization and computer graphics, 23(9), 2165-2178.
2016
Non-expert interpretations of hurricane forecast uncertainty visualizations
Citation: Ruginski, I. T., Boone, A. P., Padilla, L., Liu, L., Heydari, N., Kramer, H. S., ... & Creem-Regehr, S. H. (2016). Non-expert interpretations of hurricane forecast uncertainty visualizations. Spatial Cognition & Computation, 16(2), 154-172.
*Downloads: Data
*Downloads: Data
Evaluating the impact of binning 2D scalar fields
Citation: Padilla, L., Quinan, P. S., Meyer, M., & Creem-Regehr, S. H. (2016). Evaluating the impact of binning 2D scalar fields.IEEE transactions on visualization and computer graphics, 23(1), 431-440.
*Downloads: Supplementary Materials, Data (made available Nov 12th 2017, see documentation)
*Downloads: Supplementary Materials, Data (made available Nov 12th 2017, see documentation)
2015
The influence of different graphical displays on nonexpert decision making under uncertainty
Padilla, L., Hansen, G., Ruginski, I. T., Kramer, H. S., Thompson, W. B., & Creem-Regehr, S. H. (2015). The influence of different graphical displays on nonexpert decision making under uncertainty. Journal of Experimental Psychology: Applied, 21(1), 37.


