Understanding the U.S. National Security Strategies Part 1:Visualization of Country Mentions
By Ayme Tomson
May, 2020
What is a National Security Strategy?
The U.S. National Security Strategies (NSS) are formal annual administrative documents required by the
Executive Branch of the U.S. government per the Goldwater-Nichols Department of Defense Reorganization
Act of 1986. Interestingly, these documents are usually published approximately once per presidential term.
While an original expectation of the NSS was to outline the ”grand security strategy” underlying all U.S.
policy, this is not the case. Democracy is complex, and a more accurate expectation is that the NSS outlines
the preferences of the current Executive Branch towards a current or future ”grand security strategy”.
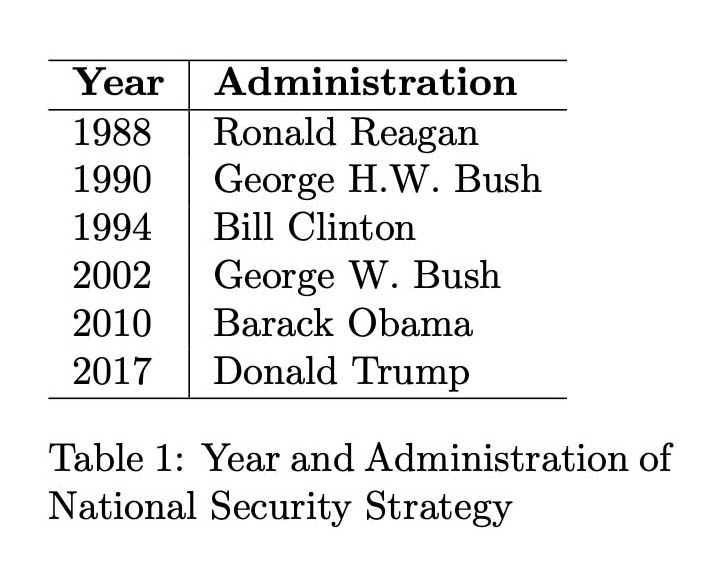 As of today, a total of 17 NSS’s have been published. The first was
put out by the Reagan administration in 1987. The most recent was
released by the Trump administration in 2017. For the purposes of
this project, I have chosen to focus primarily on NSS’s where a change
in administration occurs. The exception is that I use the 1988 NSS
instead of the 1987 NSS. As the NSS in 1987 is the first such document
written, I wanted to allow for formatting and structure to solidify and
so begin with the 1988 NSS (Snider, 1995). The chosen NSS’s for this
project and associated administrations are shown in Table 1.
A NSS is a unique document; it provides a reference for policy-making within an Executive Branch and also sets the stage for political discussion between the Execute and Congressional Branches of the government. It is worthwhile to know what countries are of interest with respect to a presidential administration’s preferences towards a ”grand security strategy”.
As of today, a total of 17 NSS’s have been published. The first was
put out by the Reagan administration in 1987. The most recent was
released by the Trump administration in 2017. For the purposes of
this project, I have chosen to focus primarily on NSS’s where a change
in administration occurs. The exception is that I use the 1988 NSS
instead of the 1987 NSS. As the NSS in 1987 is the first such document
written, I wanted to allow for formatting and structure to solidify and
so begin with the 1988 NSS (Snider, 1995). The chosen NSS’s for this
project and associated administrations are shown in Table 1.
A NSS is a unique document; it provides a reference for policy-making within an Executive Branch and also sets the stage for political discussion between the Execute and Congressional Branches of the government. It is worthwhile to know what countries are of interest with respect to a presidential administration’s preferences towards a ”grand security strategy”.
A NSS is a unique document; it provides a reference for policy-making within an Executive Branch and also sets the stage for political discussion between the Execute and Congressional Branches of the government. It is worthwhile to know what countries are of interest with respect to a presidential administration’s preferences towards a ”grand security strategy”.
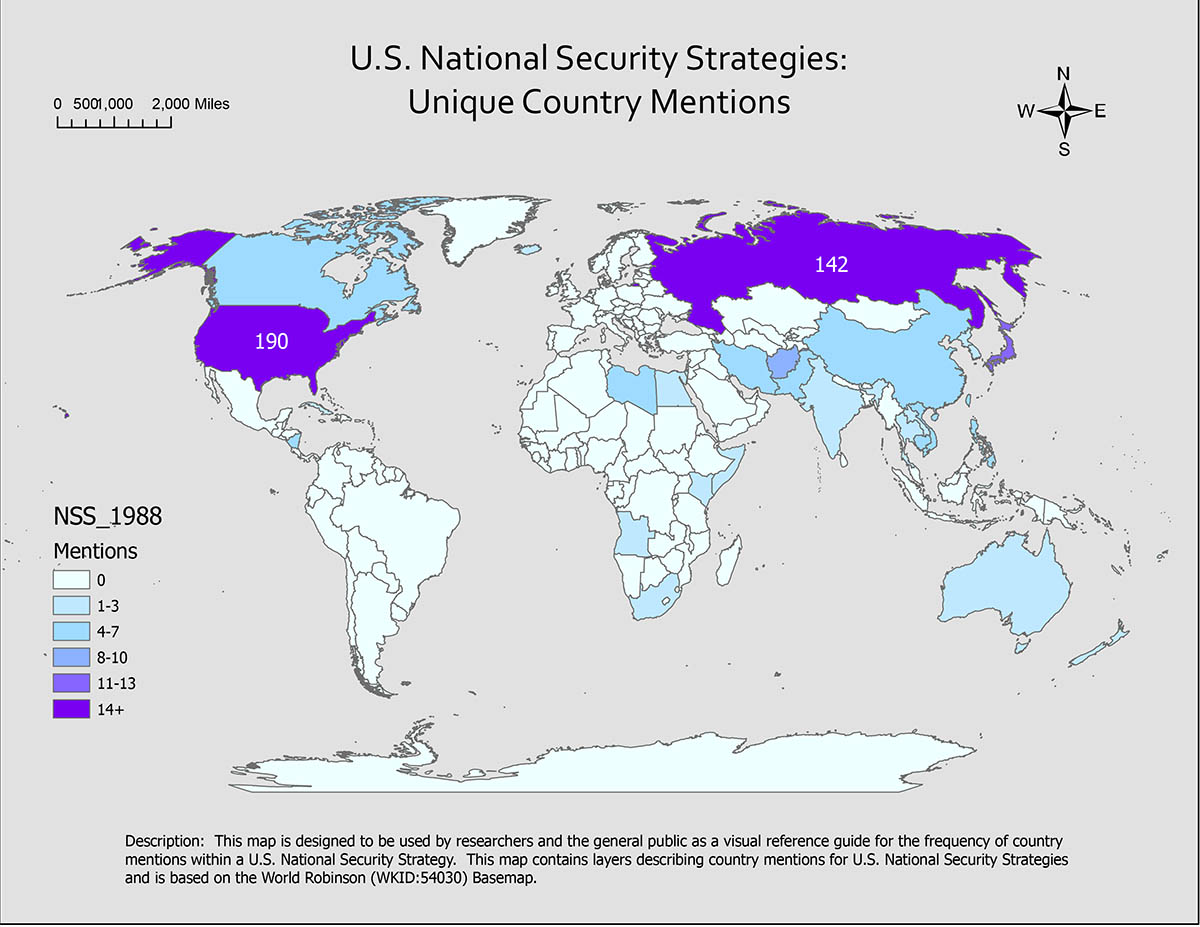
Figure 1: 1988 NSS
How Can We Find Country Mentions?
To make this information as meaningful as possible, I am combining two research methodologies. From Natural Language Processing (NLP) and Information Extraction, I am using Named Entity Recognition to find references to countries within the NSS’s. To visualized these country mentions, I am using ArcGis (Pro) to build a map of the world and overlay the country mentions. These mentions show the different parts of the world each Executive Branch considers relevant enough to include in their preferred ”global security strategy”.
Named Entity (NE) Recognition and SpaCy
In order to find the countries mentioned in the NNS’s, several steps need to occur:
- Make sure files are readable to code
- Run NE recognition software to find all NE’s in files
- Human annotation to create a master list of NE’s of interest (countries)
- Find number of mentions for each country in each file
The file cleaning and NE recognition are all done using Python. You can get access to the data files and my code at my Github repositiory https://github.com/atomson/NSSwithArcGISandNLP. I used the SpaCy library for run NE recognition. SpaCy is a great software and it is also free to use. I particularly like the NE labeling that SpaCy provides. It finds all NE’s and assigns them to particular categories using labels. There are 18 NE labels; I chose 3 for this project: GPE (countries, cities, states), NORP (nationalities or religous or political groups), and LOC (non-GPE locations, mountain ranges, bodies of water). Other labels include things like DATE and TIME. Labels that might be of future interest are PERSON (people, including fictional) and FAC (buildings, airports, highways, bridges, etc).
Here are the SpaCy outcomes:
- Number of NE’s in data: 6085
- Number of unique NE’s in data: 1481
- Number of unique NE’s in chosen 3 labels: 415
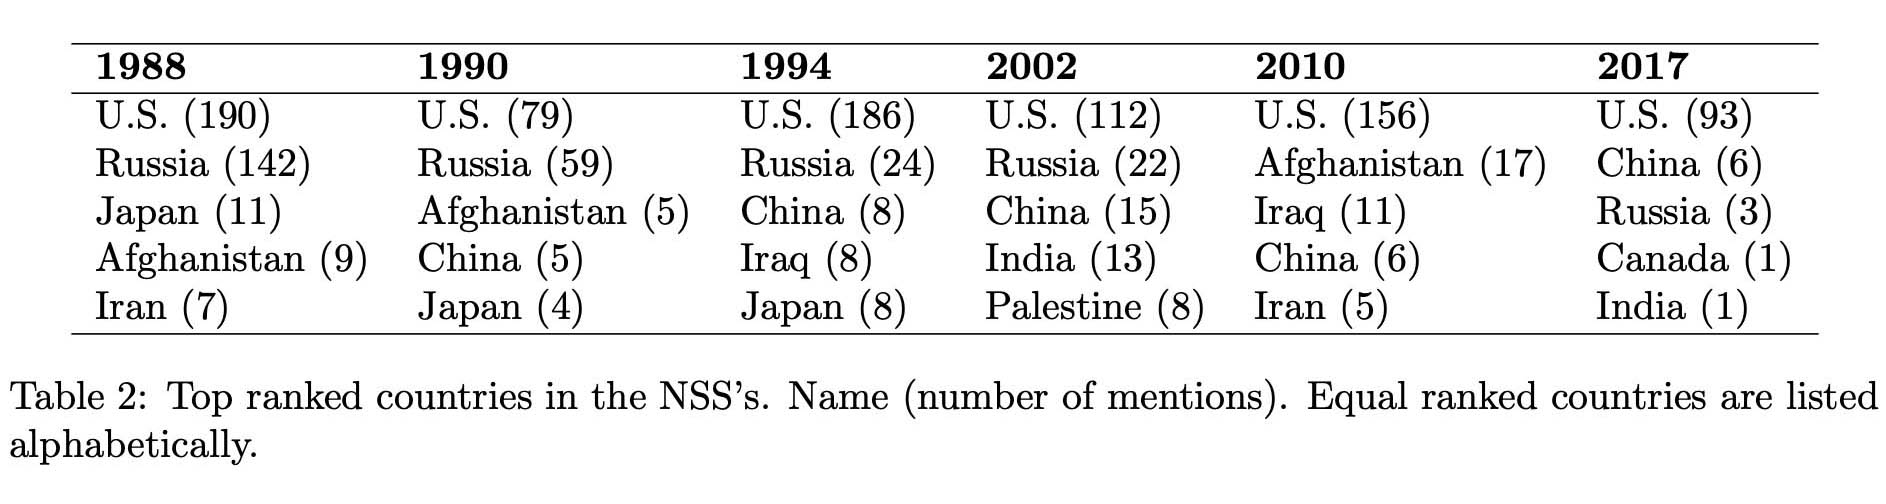
The 415 NE’s are not the final list. Human annotation is necessary to account for misspellings and other document related issues. For example, in the process of finding NE’s it is not useful to remove all white-space and capitalization. These characteristics of the text are useful to find proper names and also to determine noun phrases. So, some of the NE’s are different by only a line-break in a page. Other differences include misspellings and copy error from the original pdfs. This annotation resulted in 120 final NE’s. I then wrote code to assign all versions of an NE to the same NE. Table 2 shows the top 5 NE listings for each NSS. I’ve focused specifically on countries for this project. My interest in regional terms requires additional work as these terms apply to different countries and locations over time. Future work will also examine mentions for geographical entities such as bodies of water (e.g. Persian Gulf). We can see that the U.S. is the most referenced country - not surprising.
Visualizing Country Mentions and ArcGIS
A challenge with presenting data is to find the most appropriate form of communication. In order to understand where in the world each U.S. presidential administration is focusing as important to national security, let’s look at a globe. ArcGIS is a suite of tools based on a geographic information system (GIS). It allows for visualization of data that is linked to geo-spatial data. Again, there are several steps to executing this portion of the project:
- Find appropriate world map
- Import and link the NE countries and the number of mentions in each NNS
- Design the visualization
Any time we try to display 3-dimensional data in 2-dimensions, we have to make compromises. I’ve chosen to up a Robinson projection as the base map for this project because its primary purpose is to be visually appealing. As the goal of the visualization is to help viewers understand the change between U.S. administrations’ focus on individual countries relating to national security. Overlying this base-map, is a layer showing how often countries are mentioned in a given NSS. The color is based on ColorBrewer scheme (https://colorbrewer2.org/#type=sequential&scheme=Purples&n=6). The design of the visualization included category size (how many colors to use) and color choice.
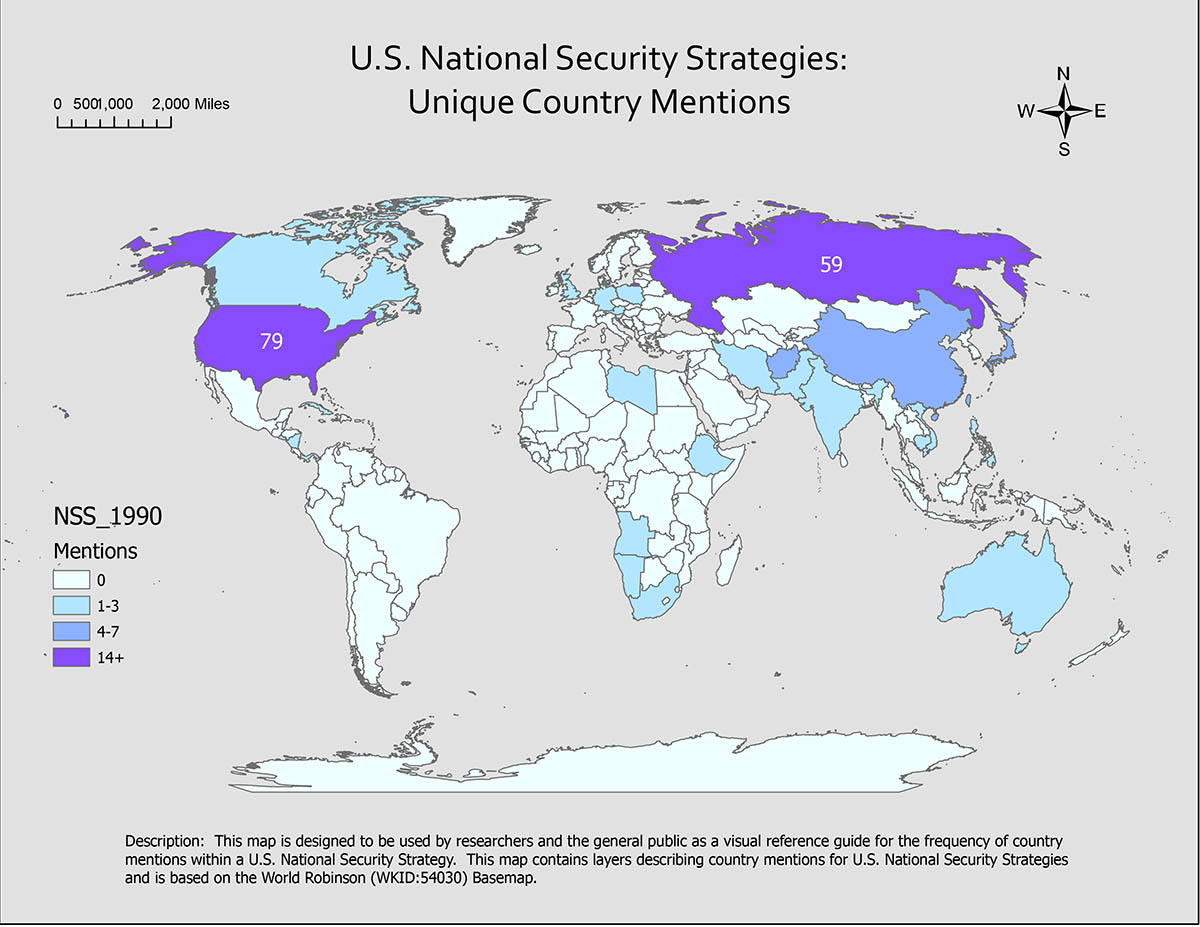
Figure 2: 1990 NSS
Some Interesting Observations
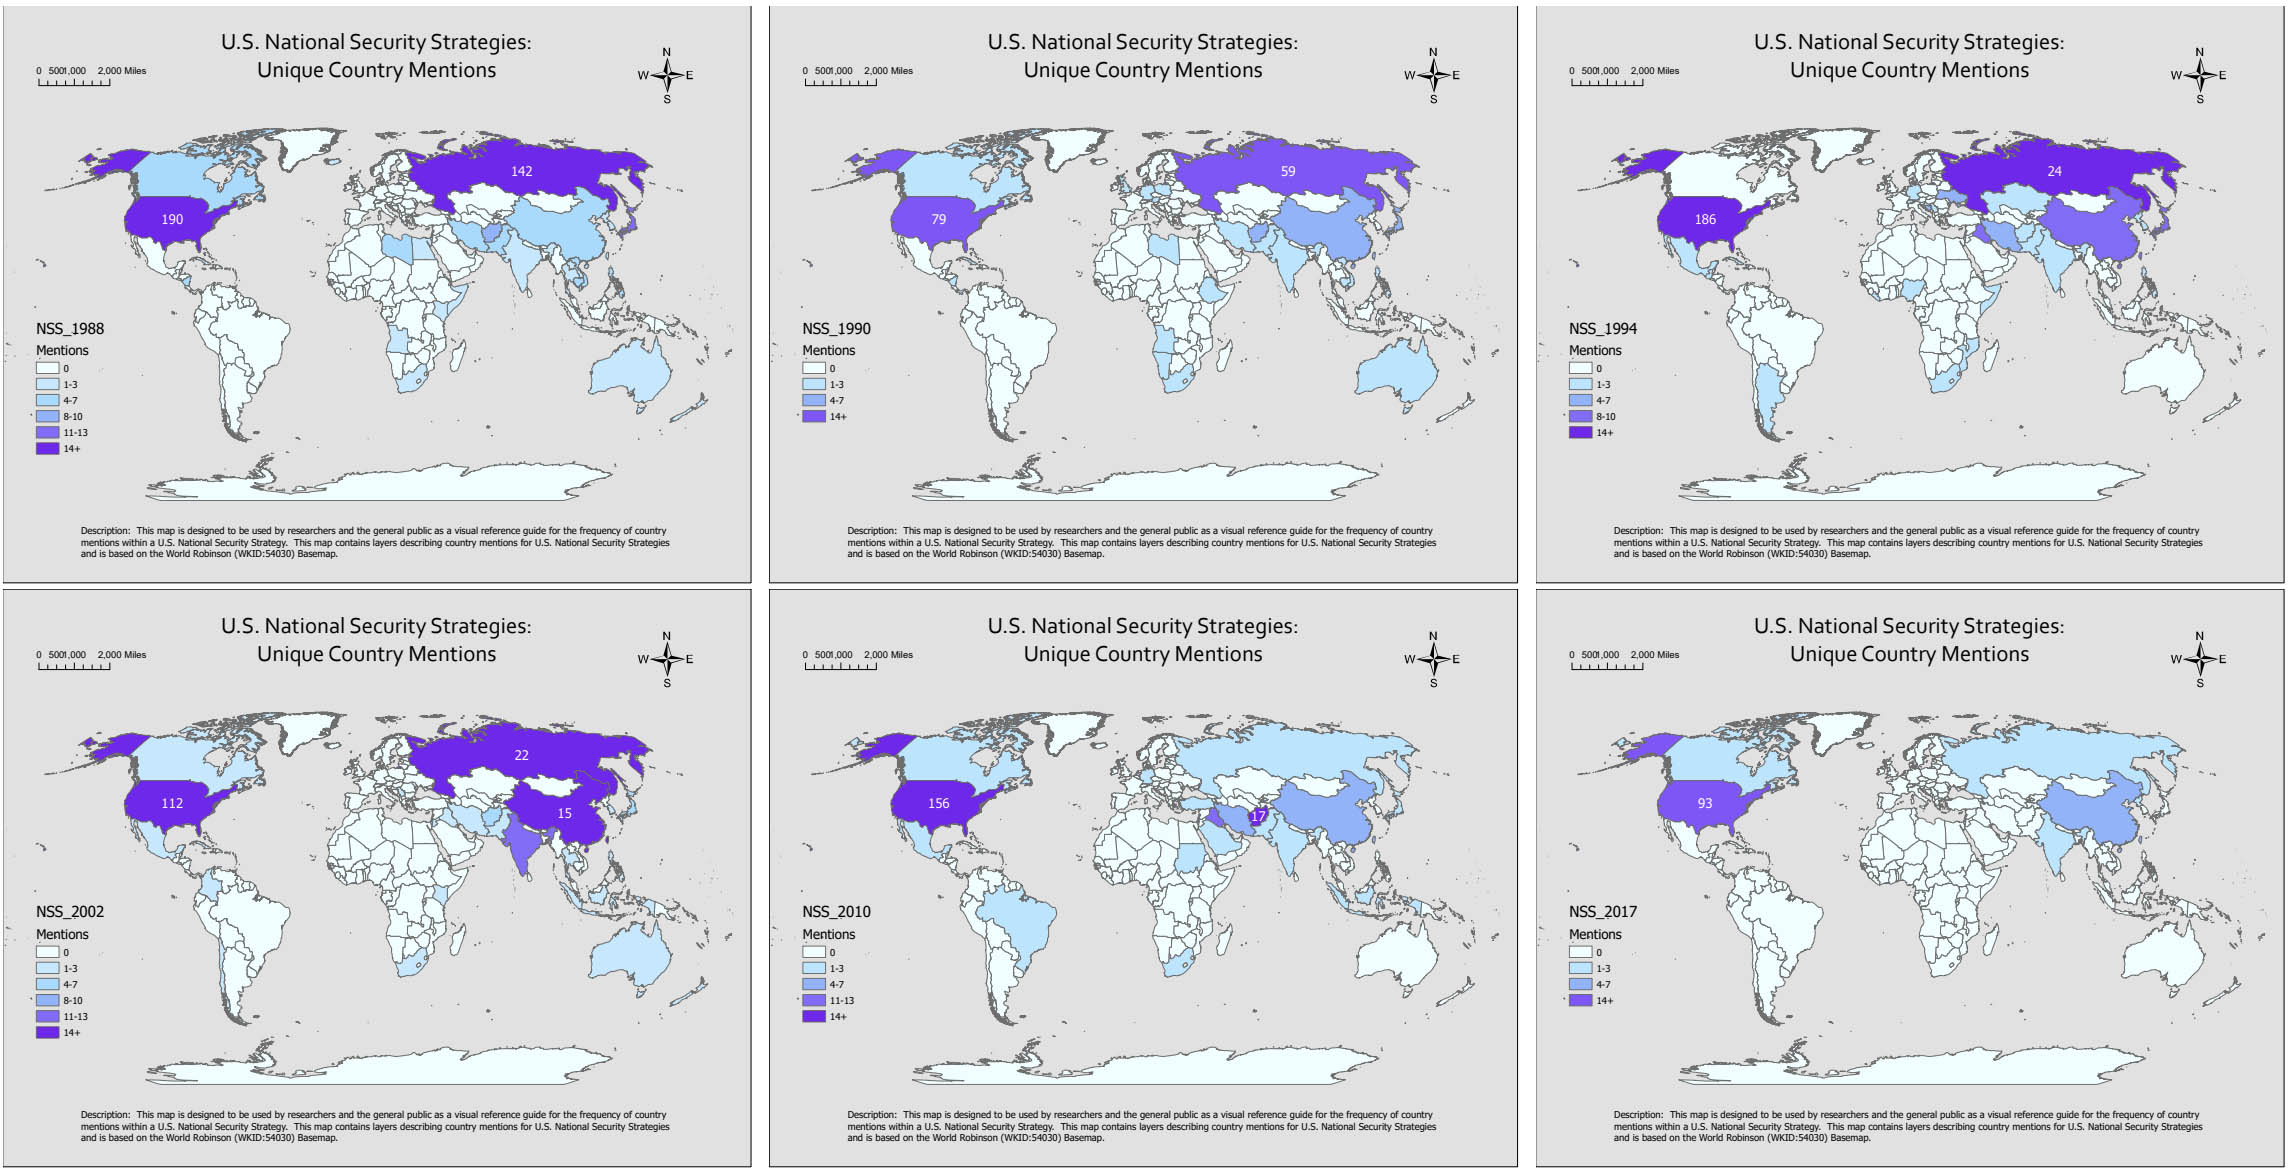
Let’s start with the 1988 NSS. This was a time in the Reagan administration near the end of the Cold War between the U.S. and Russia. Also the Chernobyl disaster occurred in 1986. It makes sense to see such a high number of mentions for Russia (142). Figure:3 shows this with the darker colors for the U.S. and Russia. We also see that Japan and Afghanistan are mentioned more than other countries. Something to think about, the lightest color on the map represents countries that are not mentioned individually at all. For the 1988 NSS we might say that no country in South American, and almost no country in Africa warranted a mention with respect to U.S. national security.
In 1990 Bush Senior was U.S. president and the Cold War has all but ended. We see fewer country mentions overall, but still a clear majority of U.S. and Russia mentions. From examining the full range of NE’s in the document, I can report a healthy number of references to Eastern Europe perhaps having to do with the fall of the Berlin Wall. China, Japan, and Afghanistan are the next most talked about countries. Also, perhaps part of the continued interest in middle east countries stems from events like the Exxon Valdez Oil Spill in 1989. No direct references to the oil spill exist in the 1990 NSS document. Climate Change was still losing the fight to be a player in U.S. national security.
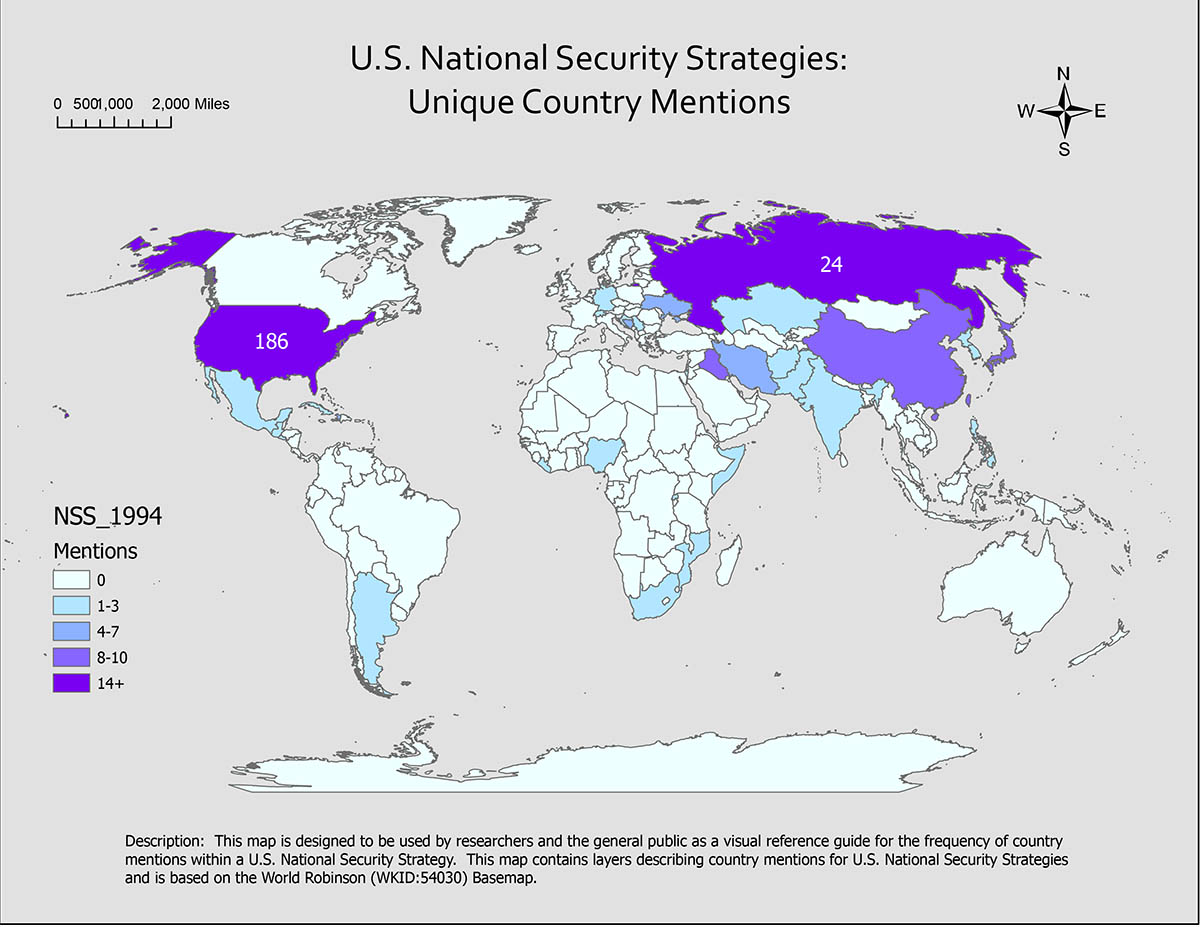
Figure 3: 1994 NSS
Next, we jump to the 1994 NSS and the Clinton administration. Since 1990, the Cold war had ended, the Gulf War occurred, as well as the breakup of Yugoslavia and the beginning of the Yugoslav Wars, the Somali Civil War, and the World Trade Center bombing. Looking at Figure ??, we see the continued dominance of the U.S. and Russia as countries of interest to U.S. national security. Ukraine and Russia are discussed in relation to nuclear disarmament treaties. Serbia and Croatia for their roles in the Yugoslav Wars (I checked the NSS document). China, Japan continue to be discussed, but the focus shifts from Afghanistan to Iraq (Iran is consistently discussed in all NSS so far). We do see the first appearance of a South American country, Argentina. I looked more closely into the documents and this reference to Argentina relates to a treaty. Other South American countries are listed but were not picked up by the NE recognition software. These approaches are improving every day. Perhaps soon these inconsistencies won’t occur so often in NLP.
Moving into the 21st century, the 2002 NSS shows the expected U.S. and Russia mentions. It also shows a rise in the mentions of China and India both as ”developing countries” and as ”potential great powers” (taken from the NSS). In a post-9/11 world, we are not surprised to see that the Middle East is again mentioned, with Pakistan as a new addition. Looking closely at Figure: 4, of attention drawn to the eastern Mediterranean Sea. While Israel has been mentioned in each NSS that we have covered, it is given more attention in the 2002 NSS as well as a first mention of Jordan (regarding a trade agreement) and a high number of mentions for the Palestinian Territory as well. The 2002 George W. Bush administration seems to focus on the Israeli-Palestinian conflict as relevant to U.S. national security. Again we see mentions of North and South American countries relating to trade agreements. And again, Brazil should have been highlighted but was not found in the NE recognition software.
The 2010 NSS is the first of the Obama administration. Figure 5 shows the country mentioned within this administrations framing of U.S. national strategy. One of the changes in our visualizations is the lack of mentions for Russia. The U.S. still reigns supreme for mentions in the 2010 NSS, but now Afghanistan is the 2nd most mentioned country with 17 mentions. Countries in the Middle East maintain in U.S. focus with respect to national security. China (and Russia and India) are ”key centers of influence”, and Israel are still making appearances. We finally have a Brazil mention (not related to trade but rather as an ”increasingly influential nation”). So what happened in the world from 2002 to 2010? Well, we have the War of Terror that explains some of the Middle East discussion.
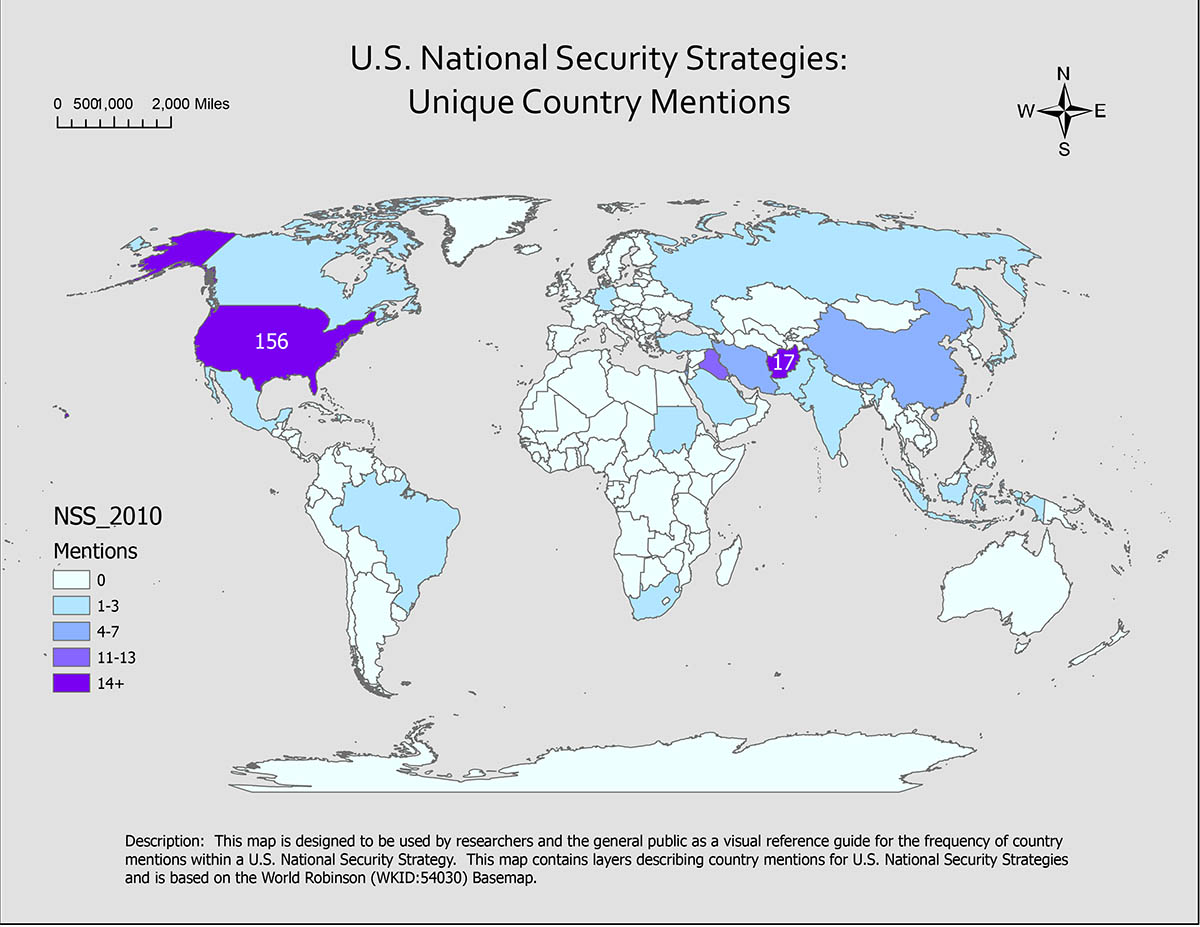
Figure 5: 2010 NSS
In 2017, President Trump’s administration put out the most recent NSS. This NSS has the fewest country mentions of all the documents looked at so far. In looking at Figure 6, we see very few countries mentioned. The U.S. is mentioned the least number of times since the Bush senior administration of 1990. China next, then Russia and China. Looking at mentions of China within this NSS, most contexts talk about nuclear power, stealing U.S. technology, and the ”contest for power”. This NSS explicitly states that the U.S. must compete with China and Russia for ”positive relationships around the world”, alluding to proxy conflicts in developing nations. Having looked at this NSS in detail, it would be worthwhile to perform the NLP methodology of sentiment analysis to assess the tone of each administration’s ”world view” (Snider, 1995).
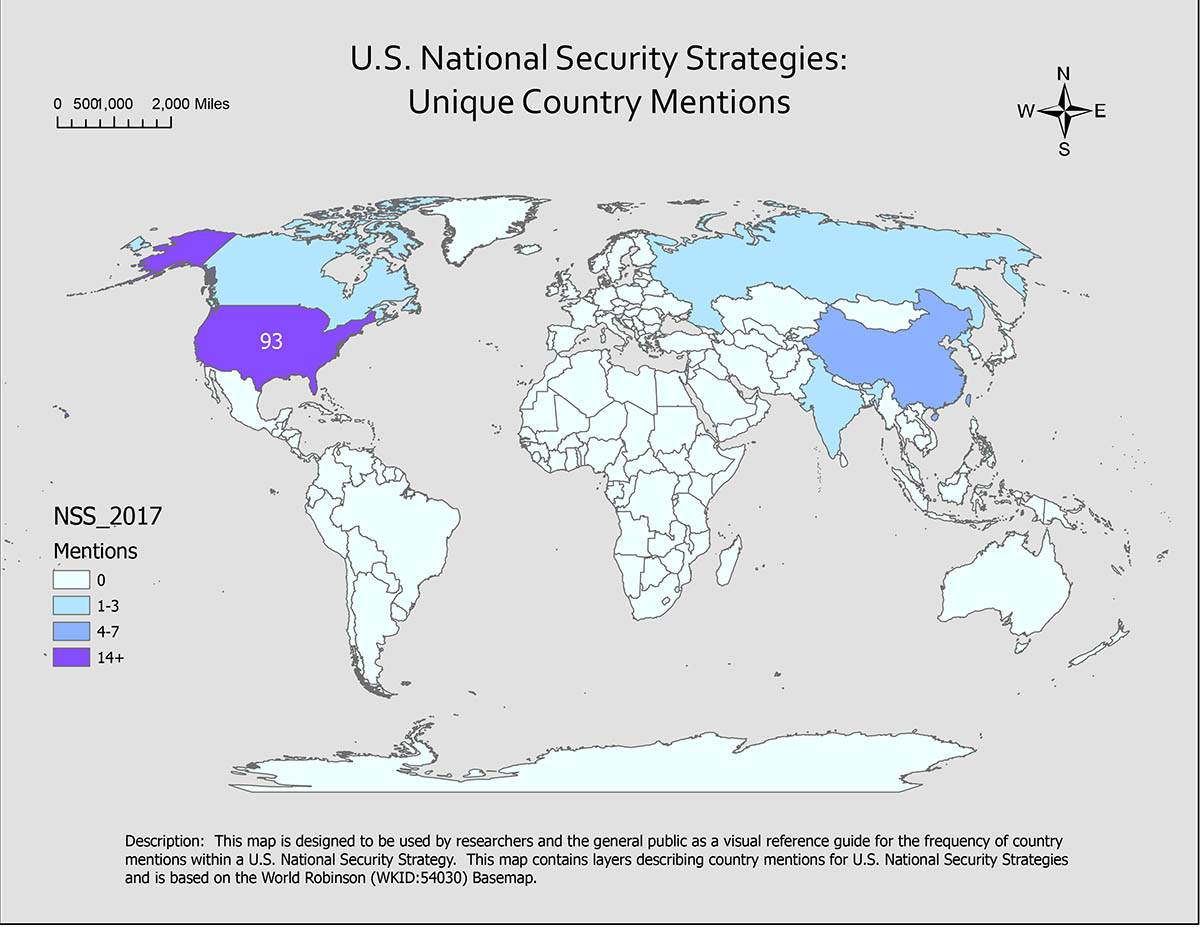
Figure 6: 2017 NSS
In conclusion, the visualizations of each NSS help us to understand which countries each respective administration associates with their preferences for a ”grand security strategy”. Of the NSS’s examined, the 2017 NSS diverges the most from established formating and content structure. The image at the top of the page contains figures for the country mentions for each NSS which are placed in close proximity to each other in hopes of facilitating direct comparison of the country mentions data between the NSS’s. Stay tuned for future work looking at regional mentions as well as sentiment analysis of the context surrounding countries and regional mentions.References
Snider, D. M. (1995). The national security strategy: documenting strategic vision (Tech. Rep.). Army war coll strategic studies inst carlisle barracks pa.